Radio Exurbia
Tool Time!
Tools are my jam! One of my favorite parts of game development is figuring out simple little tools that can speed up the development process. Since Radio Exurbia is on a tight production schedule (only 10 weeks of development time), I was worried that there wouldn't be much time to make any tools for our project.
Thankfully, I was proven wrong.
[Pictured: Me revealing how old i am :'( ]
Knowing is Half the Battle
For our alpha deadline (Oct. 31, coming up fast) it is required that we have some sort of telemetry/analytics solution set up for our project. MUSIC TO MY EARS. Time to over engineer a solution to this simple problem. Thankfully, Unreal Engine has a built-in analytics plug-in that can write events to disk. We only have to worry about collecting data for our pre-release playtests not for our final product so i don't have to worry about setting up services or external dashboards such as AWS or Datadog.
It was simple enough to set up this plugin to write JSON-formatted data for each of our playtests.
Seeing is the Other Half (I Guess?)
All the datapoints in the world are useless unless we have a way of actually generating vsualizations that can lead to actionable hypothesis-testing. One of the reasons why I love working with Unreal is how easy it is to extend the editor, and extend the editor I did!
I cooked up an Unreal editor plugin (named Nigel, of course) that parses the generated analytics files and allows us to visualize the data points inside the editor!
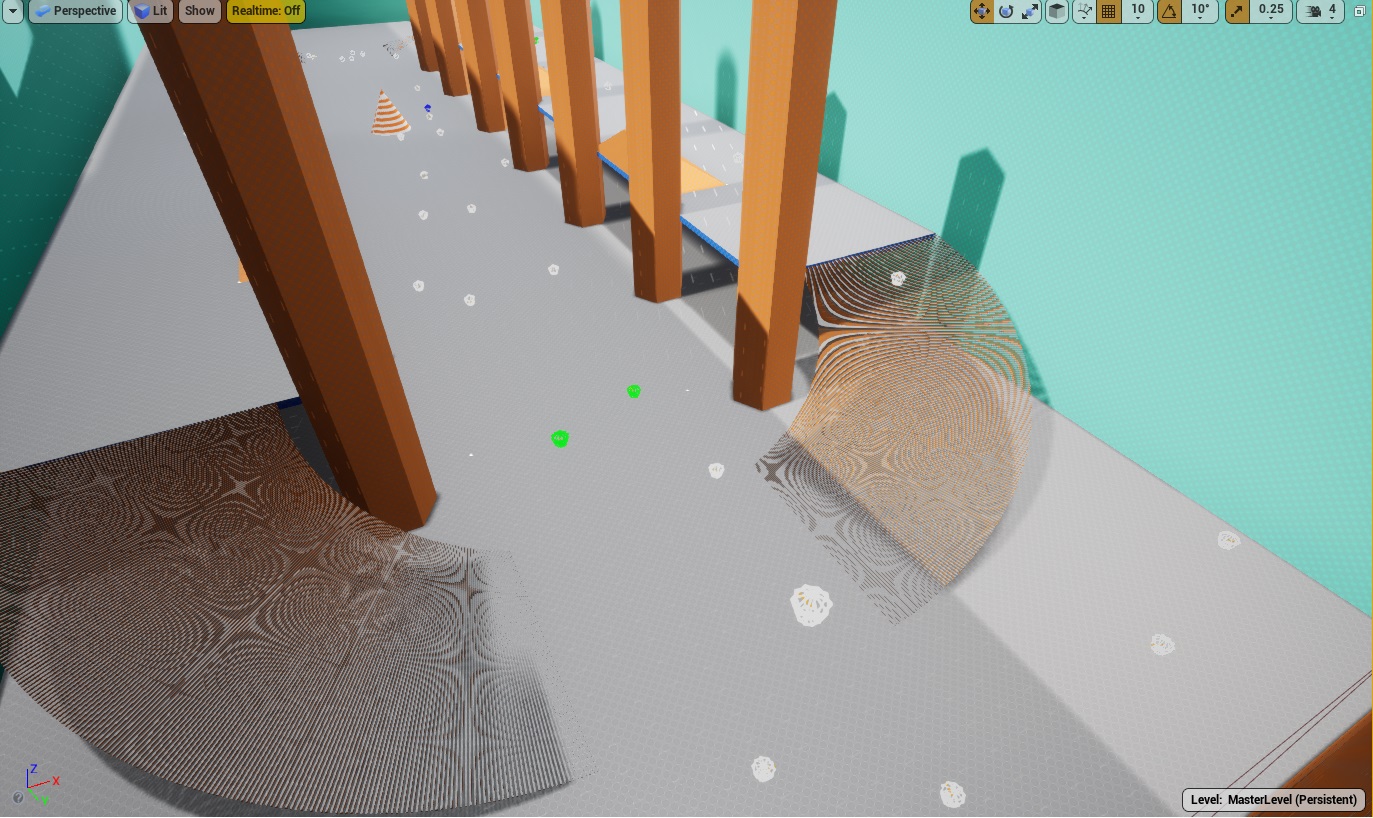

Nigel lets us see exactly where and when players are using their abilities. It can help us see where players are exploring, where they are getting stuck and where we need to focus our design efforts. But, it can be tough to see macro trends with Nigel and it isn't (currently) possible to see data from multiple playtests, so I took it upon myself to make another visualization tool to help us out...and i was bored in class one day.
If you aren't using Python are you even doing Data Science?
As a kid, I played a shit-load of Halo 2. I mean, didn't we all. But i LOVED how much data you could access as a player. Every kill, death, beatdown, and objective was captured on an easy to use online dashboard. It was DOPE.
So, with a bit of pandas and matplotlib, I decided to do something similar with our game. I wrote a script to convert the JSON to CSV, for improved human-readability, and then overlaid the data points on a top down view of our game map. There was a little bit of finangling to figure out how to map the image size to the worldspace coordinates captured in the data points, but once that was solved the rest was butter.
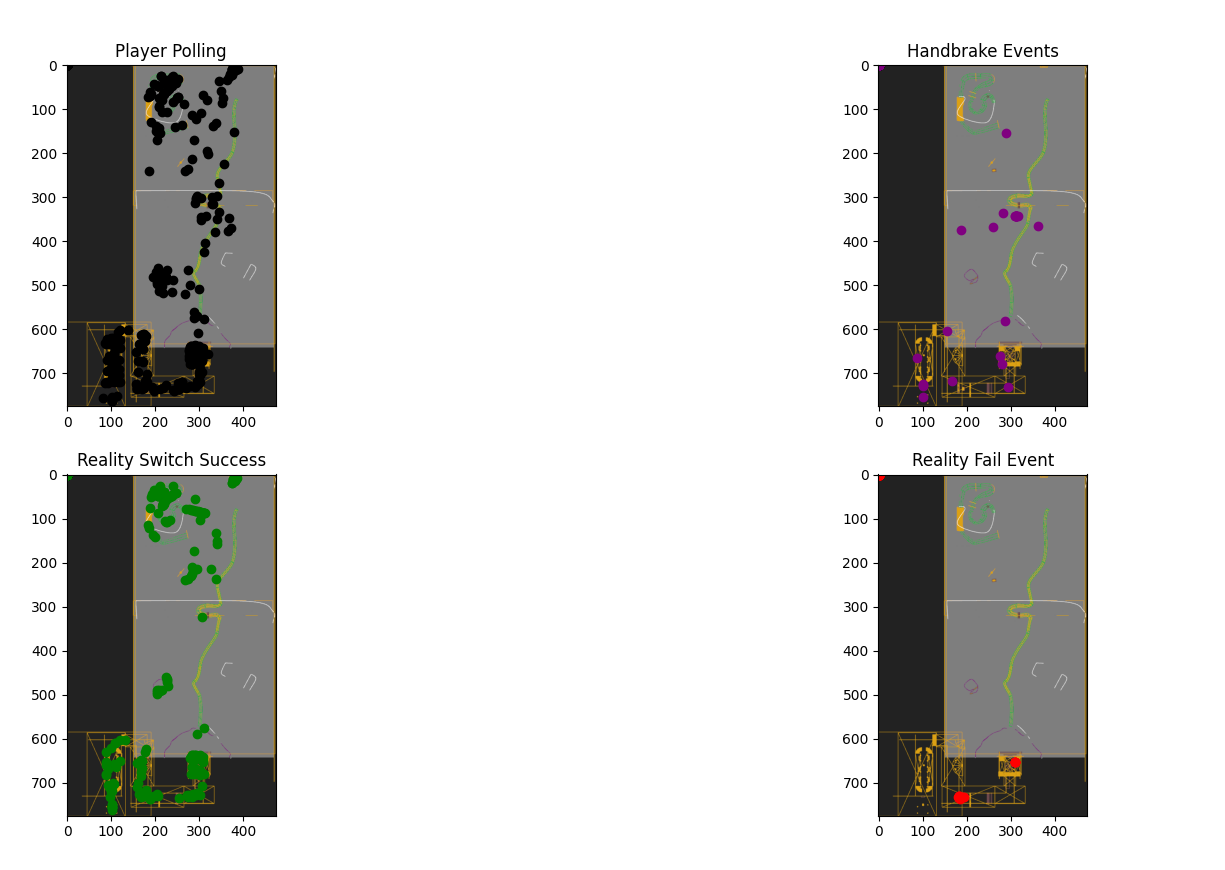
Awww yeah, now we're developing with data.
The figures above are from a whole day of playtesting between me and Jimi (n=5), and even with this limited data set we can already start to see some interesting trends. For example, we can see that there are huge portions of our map that players are not exploring. Some of that is because some players had a hard time making it out of the first area, but we see that the players that do make it out don't go over to the right-ish side of the map. And this backs up what we have, anecdotally, seen in our playtests.
Conclusion
These tools aren't the end-all, be-all for how we make our design choices but they can certainly help illuminate where we should be spending our limited development time. Data can't completely replace our design sensibilities but they can give us an idea of where we should look.
And that, is smashing.
Mike
Leave a comment
Log in with itch.io to leave a comment.